.svg "White Logo.svg")

mySidewalk added HUD Low- and Moderate-Income data to our platform. This data is a critical component of Community Development Block Grant (CDBG) applications, and helps housing and community development practitioners see where low- and moderate-income populations are located in their communities. mySidewalk has made it easier than ever to access this data, for just about any shape you can draw on a map.
What is it, how do we use it, and what do we get out of it?
At one point, we were all children (stay with me here, I promise this is going somewhere). We were smaller versions of ourselves and needed clothes that fit us. But we’re all bigger now – I know I am – and need new clothes that fit us today. It would be crazy to buy children’s clothes for ourselves today, just because they would have fit us way back when. The same is true of the data we use: why use old data that isn’t the right shape anymore, when right-sized data is available?
Much like we all need right-sized clothes, anyone who uses data to make decisions needs to know that the data they are using fits their neighborhoods today. Not only does right-sized data help leaders make better decisions, it also helps position them to win critical grant funding. Consider mySidewalk your trusted tailor, here to make sure your data fits like a glove.
Trying to Squeeze into Old Clothes with HUD Data
Right-sized data – and the best tools to access that data – are especially important for grant programs, like Community Development Block Grants (CDBG). The CDBG program has stringent requirements around which projects qualify for funding. One of those requirements is the share of residents around proposed projects that are in the “low and moderate” income bracket. For a project to qualify for CDBG, 51% of an area’s residents need to fit that definition.
The major problem is that the U.S. Department of Housing and Urban Development (HUD) only provides the kids' clothes version of this critical data. Low- and Moderate-Income Population data (i.e., Low-Mod) is provided by HUD at only the block group and place level. The block groups and places they use for this data are the same block groups and places that were defined during the 2010 Decennial Census, even though newer 2020 shapes are available. There are new areas today that did not exist in 2010, and some that existed then that don’t anymore.
Additionally, it is very difficult to determine the number or percentage of Low-Mod residents in a project area from this data, especially when that project area does not perfectly overlap with a block group shape. If you have ever applied for CDBG funding, you know how arduous and complex this process can be.
How mySidewalk Helps
This whole process is streamlined with mySidewalk. Do you need Low-Mod data for the most up-to-date shapes? Need data at more than just the block group and place level? Need to be able to see data for just about any project area you can draw on a map? We’ve got you covered.
mySidewalk has recently added several new indicators to our data library to help users strategize and apply for CDBG funding. Each of the indicators listed below is available at all sixteen geographic levels in mySidewalk, including neighborhoods and city council districts. Even better, these geographies represent their most up-to-date definitions. mySidewalk has harmonized the HUD Low-Mod data to the 2020 Decennial Census shapes. This means that you get to see the same data that HUD publishes publicly, but for the shapes that matter today.
|
Indicator |
Definition |
|
Low Income Population |
Persons earning 50% or less of HUD Area Median Family Income (HAMFI) |
|
Low and Moderate Income Population |
Persons earning 80% or less of HAMFI |
|
Low, Moderate, and Medium Income Population |
Persons earning 120% of HAMFI |
How You Can Use Low-Mod to Win CDBG Funding
HUD's current mapping tool leaves a lot to be desired. Our Custom Geography tool allows you to develop service area boundaries based on census tracts to ensure your entitlement funds are being disbursed in service areas that meet the 51% Low-Mod threshold.
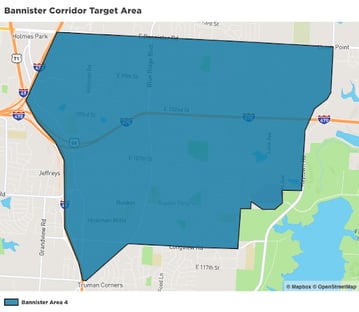
Using our hometown of Kansas City, MO, as a use case, we might be interested in a CDBG application at the site of a former mall location.
Using HUD’s online tools, we would need to locate this area on the map and select the block groups that would serve as our project’s service area. Notably, using this approach, we would have to select the low-mod population for the entirety of each block group, and calculate our low-mod percentage with those totals. This process returns less-than-precise percentages, and may include populations that we didn’t intend to include.
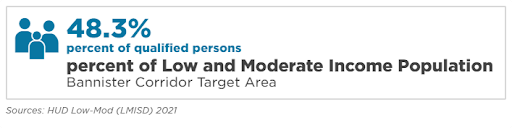
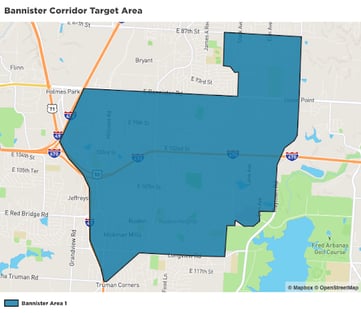
Using mySidewalk’s drawing tools allows us to be much more precise in our measurements. For example, we might draw a boundary like the one shown below. Using this boundary, we can quickly apportion HUD’s Low-Mod data to the boundary we have drawn, and only get data for that boundary.
In this example, we see that our first boundary does not have the required Low-Mod population percentage.
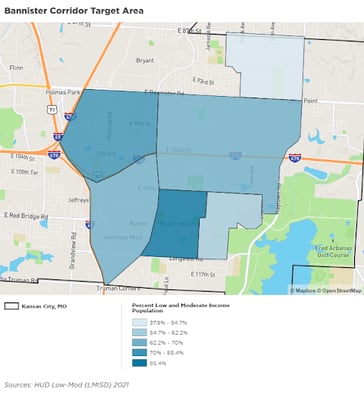
With HUD’s current proposed approach, practitioners would now need to go out into the community and perform costly housing surveys. Because the cost of doing these surveys is so high, it becomes difficult for practitioners to do exploratory analysis in their communities. This creates a situation where many parts of our community that could really use CDBG assistance will never receive it, simply by virtue of going undetected. Fortunately, with mySidewalk, we can make quick adjustments! We can re-draw our boundary, and quickly see if the new shape gets us to 51% Low-Mod Population.
 .
.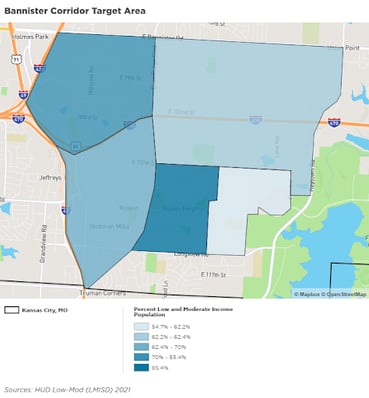
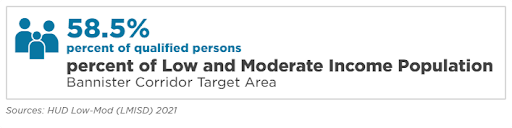
With our new boundary, we can see that we’ve exceeded the required 51%. At this point, we can continue experimenting with boundaries, or continue our application with the captured block groups and/or census tracts.
The ease and flexibility of mySidewalk’s data tools make it easy for housing and community development practitioners to strategize target areas in their communities. Because the data is available in mySidewalk for the Census 2020 shapes, practitioners always know that the data they’re working with is up-to-date and spatially accurate. Additionally, mySidewalk’s drawing tools allow users to see Low-Mod data for unconventional shapes that they previously couldn’t. This substantially lowers the cost to strategize CDBG (and other community development funding) investments, and allows users to detect areas in their communities where investment is needed, that otherwise would have gone undetected.
mySidewalk is a Trusted Partner
With mySidewalk, you can now easily measure the Low- and Moderate-Income population for just about any service area you can draw on a map. You also know that the data you’re using is the best representation of reality that we currently have access to. Equipped with right-sized data, you can strategize CDBG projects for your community, and make well-informed decisions about potential service areas.
mySidewalk’s Low-Mod data, and the tools we provide you to access that data, are like a suit or dress that fits you just right: tailored to your needs today, rather than ten years ago. With grant funding at stake, mySidewalk gives you a leg up, and makes it easy to unlock the power of HUD’s data.
Get in Touch
Applying for CDBG dollars? Need access to this critical data? Want to commiserate about some of the awful fashion choices we all made when we were younger? Fill out this quick form, and we’ll make sure to connect you with the right member of our team!

Share this
Locate Your Community's Affordable Housing with Data from the NHPD
5 Eye-opening Data Lessons after a Year of Sheltering at Home

No Comments Yet
Let us know what you think