
Each month, mySidewalk hosts a webinar in partnership with the National League of Cities. In April, we focused on how Public Health departments can leverage community data to respond to COVID-19 in their communities. We were fortunate to have guest speakers from both Maricopa County (located in Phoenix, AZ) and the Unified Government of Wyandotte County and Kansas City, Kansas. If you missed the live conversation, keep reading for a quick recap below.
How Public Health Feels About COVID-19
Exhausting, challenging, burnt out.
These are just a few of the adjectives that describe how Public Health departments are feeling in the aftermath of the COVID-19 pandemic. To say it's been a bumpy couple of years is an understatement, but the teams at Maricopa County and Wyandotte County have found positive ways to make a difference in their respective communities. Let's take a deeper look at how each team is using community data to fight COVID-19 inequities.
Maricopa County's Data Storytelling Approach
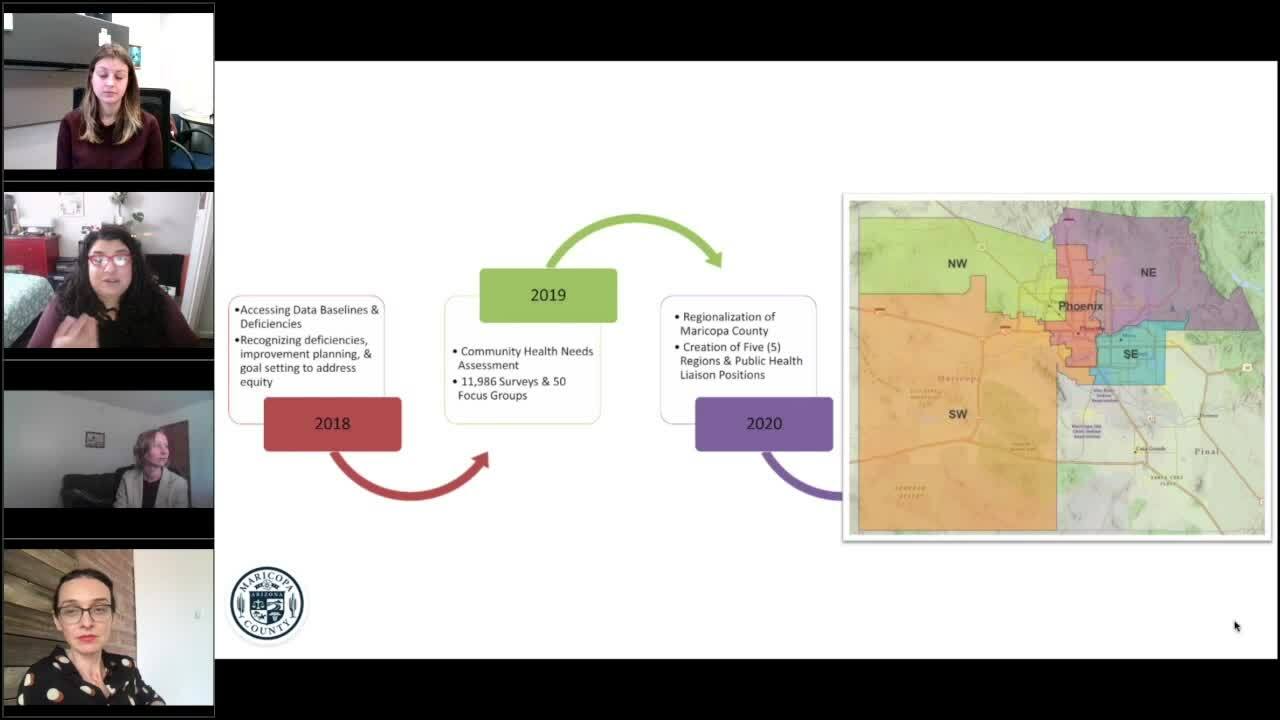
Lilliana Cardenas and Annie Daymude were faced with a major question: How is COVID-19 impacting our residents? Lilliana, manager at the Office of Community Empowerment, shares that Maricopa is the largest county health department in Arizona and is responsible for about 4.5 million residents.
After dividing Maricopa County into five regions, Annie (a community health impact analyst) and Lilliana shared the data findings with their emergency response team to ensure that vaccine sites and testing sites were spread equitably throughout the county.
"When COVID hit, because we had already developed this regional map, we pretty much presented it to our emergency response team and said, 'Hey, here's an idea— what if we look at the county through this lens and figure out how to equitably distribute and increase access to vaccines?'" Lilliana says.
The data made it easier to pinpoint problems, provide solutions like mobile testing centers, and bring the vaccine to areas where residents were less likely to travel.
They also obtained feedback about how COVID-19 impacted residents —almost 5,000 responses — through an open-ended survey.
"We were blown away," Lilliana says. "We got a pretty significant response rate overall from the survey."
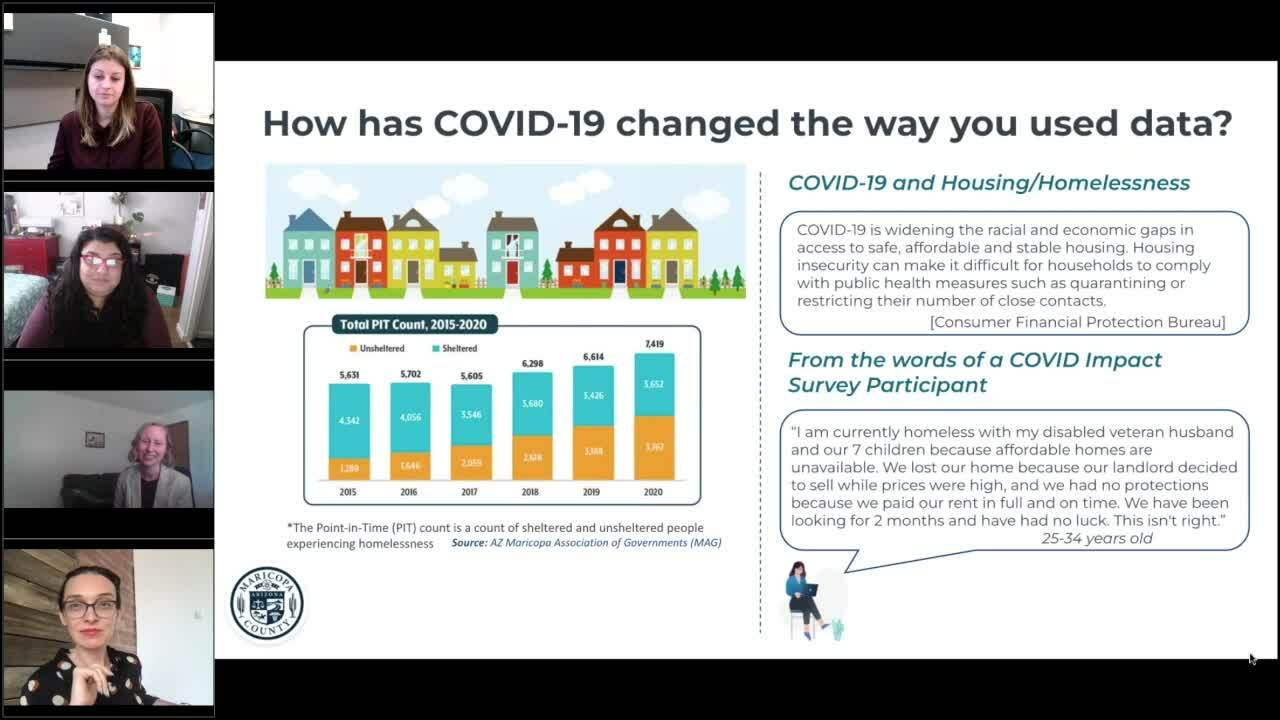
With this information, Maricopa County Health understood exactly how the virus was impacting residents: their job status, their financial status, their housing situation and more.
UG Public Health's Data Science Approach
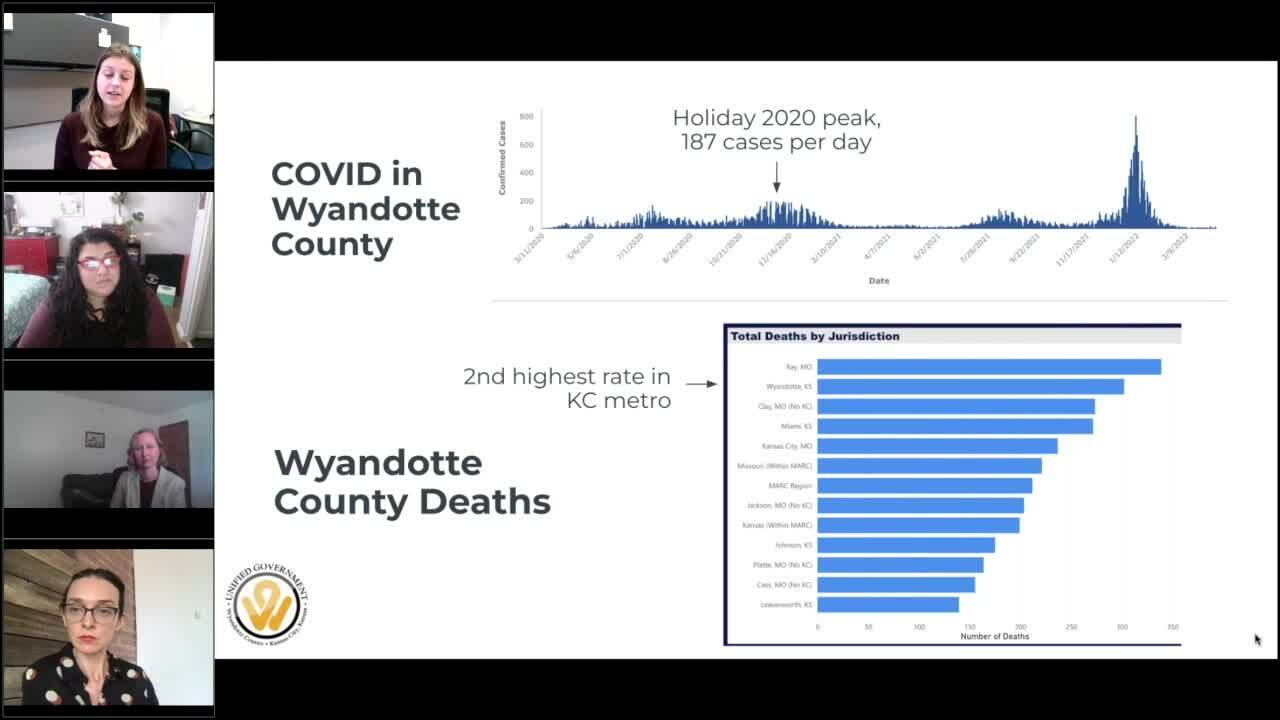
Hannah Conner, an epidemiologist at Wyandotte County, shares that early on the Kansas City metro area was hardest hit by COVID. In 2020, the area experienced about 187 cases per day during the holiday season. When studies showed that the Moderna and Pfizer vaccines offered high rates of protection and lowered the risk for serious infection and death, Hannah and her team expected that vaccine adoption rates would be high.
Although health care professionals and older populations were quick to adopt the vaccine, Wyandotte County quickly fell behind — vaccine adoption rates slowed once it was available to everyone. Several factors affected the decision-making process, including mistrust of pharmaceutical companies and misinformation about the vaccine itself.
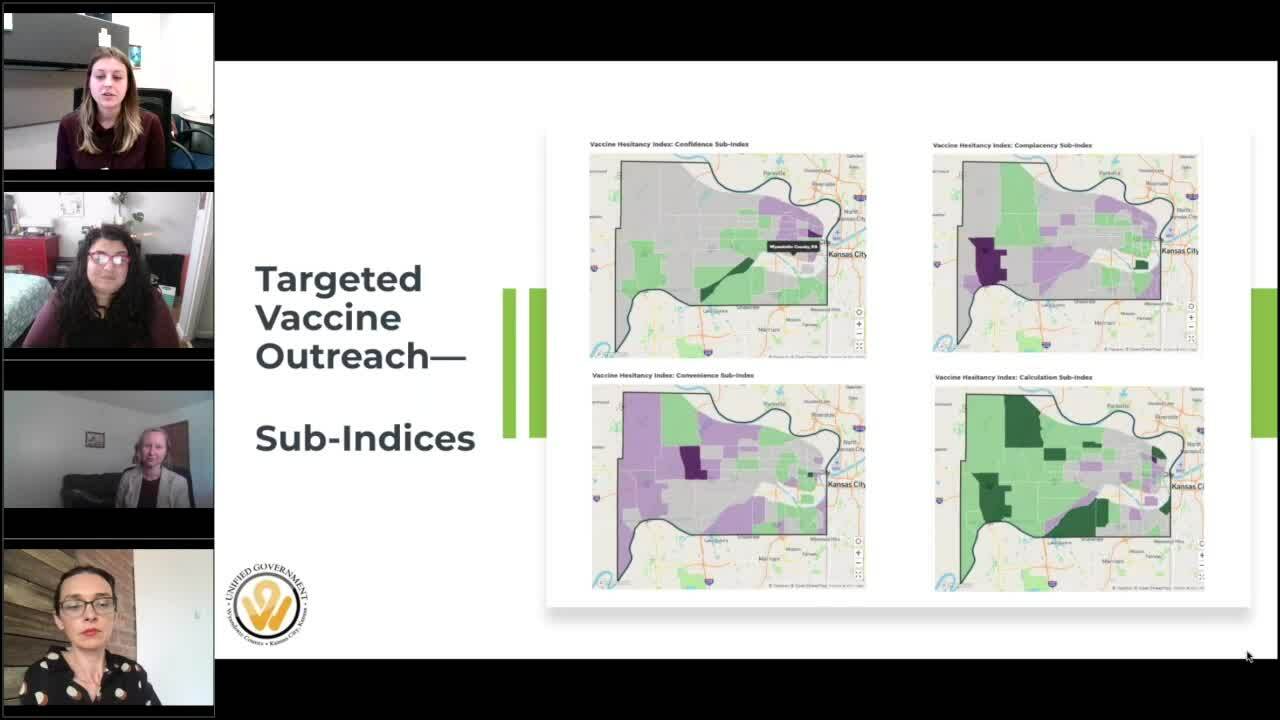
Wyandotte County created a quantitative index that showcased a detailed view of areas with vaccine hesitancy.
"To get this index that would show us the different levels of vaccine hesitancy across the county — even being able to produce that was incredible," Hannah says. "We utilized metrics that already existed from ACS, the CDC, from the EPA, and then we were able to combine that with the vaccine administration data that we already had to create this overall index."
With this information in hand, Hannah and her team created personalized messaging to target each area of the county to address specific concerns from residents. It also helped Wyandotte County to better navigate vaccine hesitancy. She says that the data and index were big reasons why Wyandotte County went from being the least vaccinated county to the third-highest vaccinated county in the greater Kansas City area.
"What's more special than the index we created is that we got to look at this 4Cs Model — the reasons why people are hesitant to vaccines," Hannah says.
Two Approaches, Two Great Outcomes
Despite the vastly different approaches, Maricopa County and Wyandotte County leveraged community data to find innovative solutions for the people in their communities. They also found ways to build city-county collaboration in the Public Health sphere. If you're interested in learning how community data can help your residents and Public Health department, view the webinar recording.
Listen to the entire recording by clicking the button below. 
Share this

Bridging Health Disparities with Data: mySidewalk's Journey to Data-Driven Empowerment

5 Remote Work Takeaways for Local Government

No Comments Yet
Let us know what you think