
We updated over 500 million data values with the latest American Community Survey (ACS) 5-year estimates 2015-2019.
Reliable, relevant data is foundational for meaningful community decision-making and storytelling. Our latest update from the ACS is a part of our promise to provide more people with accurate and granular data, saving them from the long and bump road of data processing.
On December 10th--the Census Bureau released the latest data from the leading source of population statistics for communities across the country: the American Community Survey (ACS). In just 3 business days, the mySidewalk data team was able to process and update over 500 million data values into our Data Library.
What does that mean for you? As of the morning of December 15th, we've updated all ACS data values and visualizations in mySidewalk with the latest 5-year estimates. The 2014-2018 estimates were replaced with the new values and are available for mySidewalk users to download, visualize, and publish quickly and easily.
The data team prepared for weeks to ensure our partners had quick and ready-to-use access to the most current data. We believe change can happen when people have good information to guide them, and using detailed, relevant data is step one. The ACS is an important resource in our Data Library, and keeping the data up-to-date is a part of our commitment to enabling more people to use the most reliable, unified community data that's available.
What changed with the ACS 2015-2019 update?
mySidewalk users have access to the latest set of precise demographics available in their communities, with all existing visualizations already up-to-date.
As the hallmark yearly data release from the US Census Bureau, the ACS 5-year estimates are a critical resource that drives local decisions, conversations, and billions of dollars in funding. Every year millions of people participate in the ACS, and the Census Bureau pools the most recent 5 years of data to represent average characteristics of a community over time. This year's release covers data collected from 2015-2019, which we've used to replace the previous 5-year estimates (2014-2018).
Still --even good data can't do anything by itself. Our visualization and publishing platform is designed to take data to its full potential by making it simple for anyone to get the information they need, find insight within, and make a difference.
Here's all you need to know to get started with the latest release:
- ACS data in mySidewalk now utilizes the 2015-2019 values, and is available to explore and download now using our data search tool, Seek.
- All existing mySidewalk visualizations that use ACS data are already up-to-date, and we were able to update millions of footnote references with the updated date range.
- You can visualize the data at 16 levels of geography, or use and draw your own to retrieve accurate data for custom locations and projects.
- Our platform makes it easy to visualize and share information quickly so you can analyze and communicate effectively.
|
Updating half a billion data values is a lot of work to get done in a few days. Thankfully, the mySidewalk data team put in the prep work and dedicated time to ensuring the update occurred without disturbance to mySidewalk users. To make it all happen, the team...
|
Why reliable, current data matters.
We make a deliberate effort to build a library that connects people and communities to the best data that's available to help achieve their goals.
To enable quick and useful data updates like this, we keep a system of metadata (information about data) to link our Data Library together, often resulting in more metadata than each individual source (which comes in handy when they make an error). To be effective in this system, it's also important for data to meet selection criteria such as availability (can I use this for my geography?), reliability (how precise and current is it?), relevancy (is this useful to my community and goals?).
Using the ACS as an example, we maintain the latest 5-year estimates because it provides communities small and large with detailed, reliable data on topics important for many community disciplines.
- Community data should be representative of its people. Because 5-year estimates are available at small geographies (block groups), mySidewalk users can get granular in their analysis--and even get accurate data for custom drawn geographies.
- Data needs to be defensible. With a 5-year data collection period, the sample size allows for more confidence in understanding community baselines, needs, and change.
- It sounds simple, but data needs to be useful. Covering detailed information on demographics, housing, education, public health, and economic conditions--data from the ACS is helpful for changemakers in public and private organizations alike.
We can highlight some of these differences even more when comparing the ACS 5-year estimates to the 1-year estimates, which only contains data from a single year and is less widely available.
What's the Difference? 5-Year Estimates vs 1-Year Estimates
| 5-Year | 1-Year | |
| Data Collection Period | 60 Months | 12 months |
| Smallest Geography | Block Group | Data for areas with a population over 65,000 |
| Reliability & Recency | Larger sample size, but with less current data. | Smaller sample size, but with more current data. |
| Best Used When... |
You want granular information/geographies, and data precision is more important than recency. |
You're focusing only on areas with large populations and the need for the most recent data is more important than precision. |
Source: US Census Bureau. For more info on ACS data in mySidewalk, visit our help article here.
Explore the American Community Survey 5-Year Data Estimates
Of course, the best impacts of reliable data are made when in the hands of people who use it to make a difference. Here's how a few of our partners have used ACS data with mySidewalk:
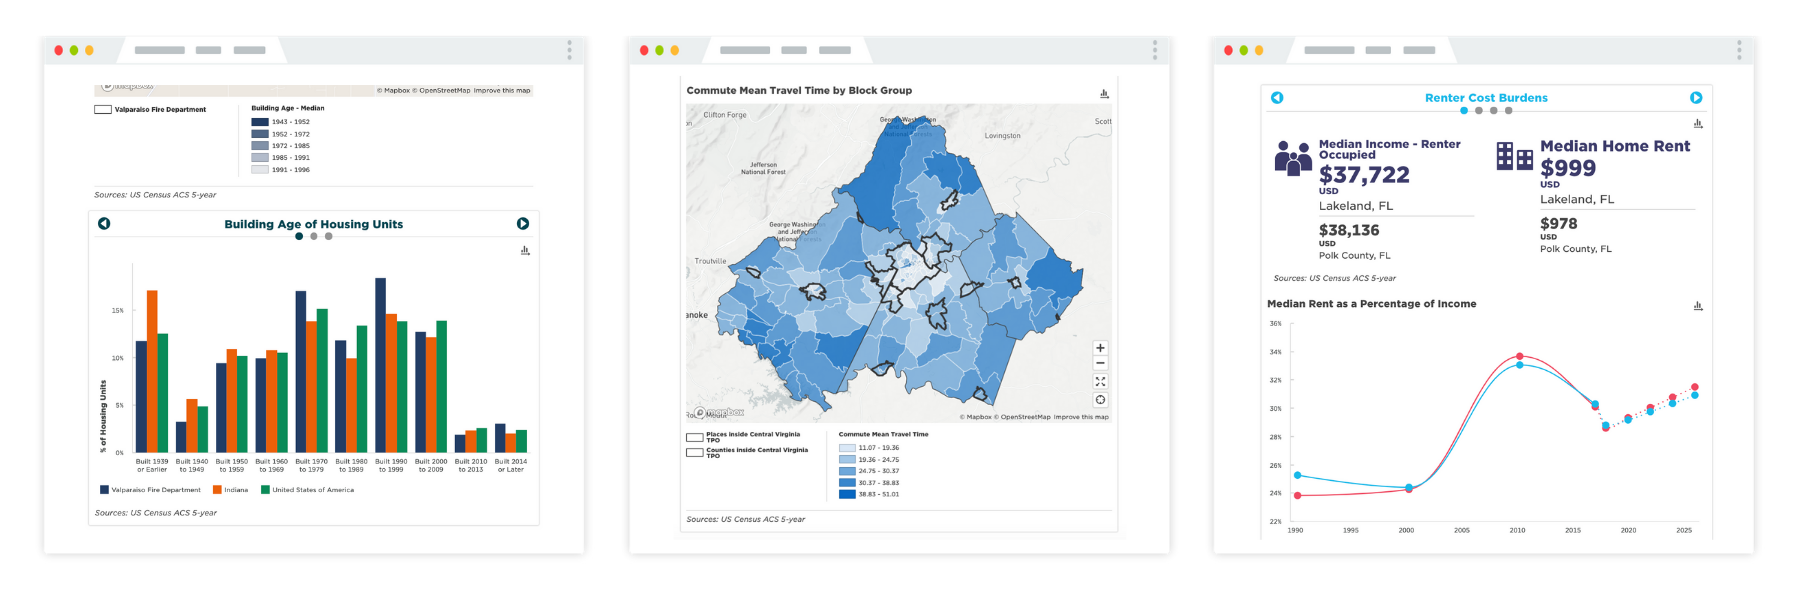
- The Valparaiso Fire Department includes community data in their Performance Dashboard to understand public safety factors like building and housing conditions.
- The Central Virginia Transportation Planning Organization uses data to aid in regional planning, digging into data such as commute time by block group.
- The City of Lakeland shares the story of existing economic conditions and paths to more equitable opportunity by analyzing baselines like renter cost burdens.
We update the ACS data in our platform every year, but the process of gathering and unifying data is the same approach we make to every source we maintain on a weekly basis. We put in this work to maintain the data because we believe your time is better spent applying for that grant your project needs, prioritizing needs in your community, or engaging your audience to make change.
Stop wrangling data and start using it.

Already using a subscription to mySidewalk?
Login today to start downloading, visualizing, and sharing the new ACS data.
.gif?width=1200&name=Introducing%20Seek.%20(2).gif)
Share this

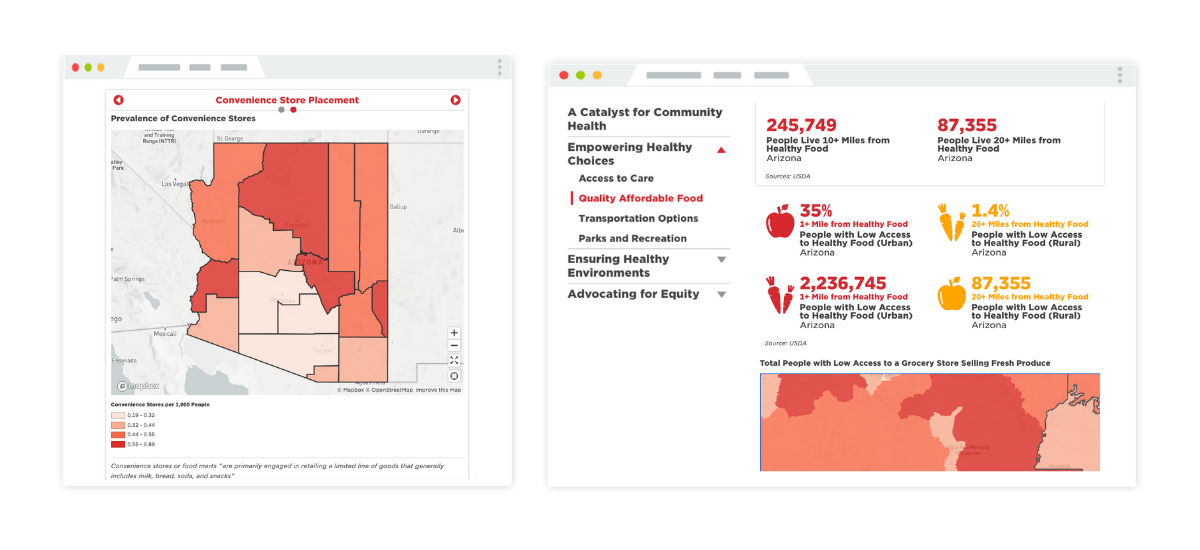
Fund Health Equity and Target Grants by Visualizing Community Data
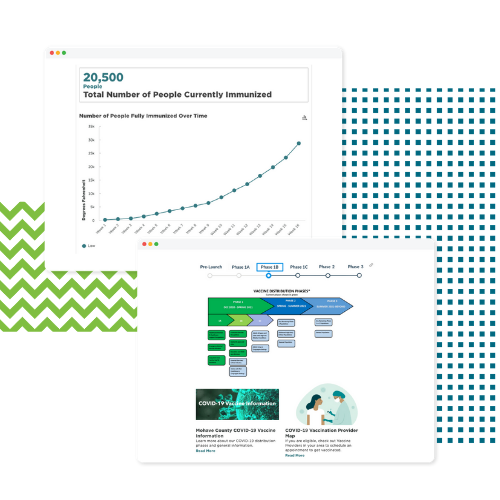
mySidewalk's COVID-19 Vaccine Tracker
No Comments Yet
Let us know what you think